Turn Data into Decisions with
Expert Tableau Development Services
At Atharva System, we maximize the value of your data by providing Tableau Professional Services and tailored Tableau solutions to your business needs across the USA, Europe, and India. Our Tableau Specialists combine both creative and analytic skills to transform data into powerful decisions. Whether you need to streamline data management procedures, create interactive dashboards, or optimize your Tableau Development Services setup, we have the experts who can cater to all your needs to put data to work. With our in-depth knowledge of Tableau's capabilities and industry excellence, we have successfully transformed simple to complex data into interactive and insightful dashboards for various sectors.
Our high-quality, end-to-end Tableau Consulting Services are designed to drive company growth, catering to startups and enterprises alike. Experience the power of simplifying data with Atharva and gain a competitive advantage in today's data-centric world through trusted Tableau Consulting.

What is Tableau?
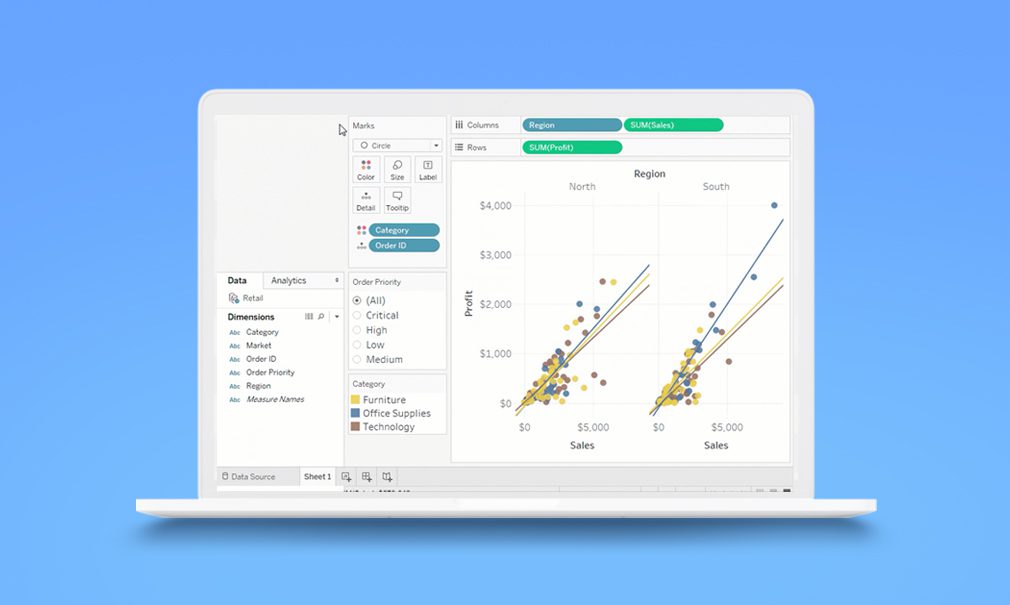
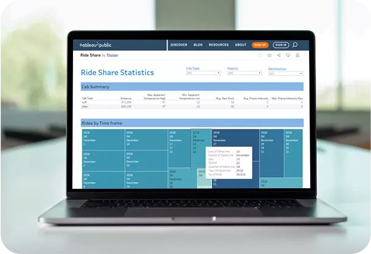
Tableau is a powerful visualization system used by the Business Intelligence Segment. By using this, companies can interpret raw information in a very easy-to-understand format. This technology creates information that every single person can understand in a company. Novice users can create customized dashboards. Information reading is fast with this tool. The images created are in the shape of worksheets and dashboards.
Benefits of Tableau Development Services
Tableau Consulting Services offer extensive benefits for companies, big or small alike. With great information and imagination, the company can speed up its operations. Through fast, interactive dashboards, this tool allows fast development and mining of information. With impressive simplicity and ease of learning, Tableau Professional Services has offered fast connections built across a range of data sources.
High Performance
Tableau offers the ability to access information and get a complete view of its operations. Companies can get a view of the organization and identify areas of opportunity and areas for improvement. You can use this high-performing BI platform to interact among departments. It will help your business operate faster and provide better ways to perform different functions.
Collaboration of data
You can connect with various information sources. It includes SAP, HADOOP, and DB tools to improve data evaluation quality. It also creates a centralized and informative dashboard that grants access to the required information for any user. They can get and use the necessary information from anywhere anytime for better business functioning.
Real time analysis
Using Tableau professional services, it is possible to understand and share information about businesses. It allows you to work with your data imagination and in an interactive way. From your system, you can access your information in the format of your choice. It also allows you to interact with your graphs, reports, and dashboards in real-time.
Mobile-Friendly
You can easily use this tool using your smartphone, as there is a mobile app available. Both IOS and Android users can use Tableau tools anywhere. Adding mobility, this tool allows you to store your statistics as a ready reference. It can also support full functionality that is available for online or desktop versions.
Multiple Information Supply
You can gain access to various information about your business functioning without any hassle. You can get all the data under a single platform. Any of your business partners or employees can access any assigned data across the business. It is readily available anywhere, anytime for better business decisions and strategies.
Data Blending
It is a process of combining data from multiple sources. This process brings invaluable information from other data sources and shows it with data from the primary data source. This helps businesses gain the right access to multiple data sources in one centralized platform for improved decisions for the best results.
Empower Your Business with
Expert Tableau Consulting Services
At Atharva System, our Tableau Consulting Services across the USA, India, and Europe can help you build high-performing data models. We utilize the capabilities of Tableau’s world-class visualization interface, dashboard sharing feature, and its several product offerings. With the power of Tableau, we can evaluate and analyse your raw data, which is nowadays very critical for different businesses. Our top experts handling Tableau Development Services have delivered several projects by unearthing critical information hidden in-depth in the data.
We have a team of Tableau experts who are well aware of the process and how to consume data efficiently. We use Tableau's built-in data analytics to provide outstanding, valuable business insights to all our clients. With our Tableau Professional Services, we harness the data and help you enhance your ability to process and utilize data efficiently. We gather data from multiple sources and integrate it to build powerful dashboard solutions through trusted Tableau Consulting.
Our Tableau Development Expertise
If you cannot visualize the right picture of your business, it would not be possible to understand whether you are concentrating on priorities. With Tableau consulting solutions from our specialists, you can have a clear picture of your data. It is managed and displayed on one screen and not scattered across different and long spreadsheets.
Tableau Consulting
We focus on understanding the unique needs of every organization and provide Tableau Consulting Services customized to unique goals. Get expert guidance and support throughout your Tableau implementation journey with our trusted Tableau Consulting team.
Tableau Implementation
Experience seamless integration of Tableau into your systems. We ensure a smooth implementation, enabling you to leverage Tableau's capabilities effectively.
Data Preparation
Our Tableau experts excel in data preparation, seamlessly integrating data from diverse sources. They skillfully filter, transform, and optimize the data, ensuring it is primed for in-depth analytics as part of our tableau professional services.
Custom Dashboard Development
Transform your data into compelling visual stories with the customized and visually stunning interface, intuitively designed to drive meaningful insights and derive maximum value through our Tableau development services.
Tableau Data Visualization
We focus on creating engaging and interactive visualizations that allow you to explore the data dynamically and easily identify trends, patterns, and insights.
Tableau Data Management
Our Tableau experts efficiently manage your data lifecycle, ensuring data quality, data integrity, and governance, providing your teams with reliable data.
Tableau Server & Desktop
Implement, optimize, and maximize the value of Tableau Server and Tableau Desktop with Atharva. Get tailored services throughout the entire lifecycle of Tableau adoption, supported by our Tableau professional services.
Tableau Migration
Effortlessly transition your data to Tableau with our expert migration services. We ensure data integrity and smooth transfer, minimizing disruption.
Tableau Cloud
Leverage the flexibility and scalability of Tableau in the cloud. Our experts help you migrate, deploy, and optimize Tableau on Tableau Cloud for enhanced accessibility and performance.
Tableau Performance Tuning
Implementing best performance tuning practices to optimize the performance of Tableau dashboards, resulting in faster data retrieval, rendering, and interactivity.
Support & Maintenance
Stay confident with our Tableau consulting services support. Our dedicated team ensures system stability, troubleshooting, and continuous optimization for uninterrupted performance.

Why Choose
Our Tableau
Consulting Services?
- Technical Expertise
- Dedicated Team
- Flexible Time Preference
- Full-Cycle Services
- Security & Confidentiality
- Free Consultation
Tableau Dashboards
Our Proven Approach to
Tableau Consulting
We are a team of seasoned experts who know how to build
Tableau solutions. We are a Tableau consulting services company
with proven expertise in building solid data models, using data
visualization interfaces efficiently, and providing effective
Tableau consulting services.

Outline of our process
1
Requirement
Gathering
2
Data
Preparation
3
Building
Visualizations
4
Deployment
and Distribution
5
Test and
Validate
6
Interactivity
and Navigation
Insights & News
Get the latest news and technology updates and take the lead.
Best Mobile App Development Platforms for 2025
June 17, 20256 Best Ruby on Rails Hosting Providers in 2025
June 5, 2025Embrace Transformation
Frequently Asked Questions
Why is there a need to hire a Tableau consulting service for every business?
If you hire a Tableau consultant, it will be the best decision to improve your ongoing business. Tableau implementation ensures optimized business processes and gives you actionable insights from shared data. At Atharva System, our expertise in providing Tableau consulting services has helped several businesses continue to excel.
Will you help my business integrate Tableau with the existing data infrastructure?
Yes. Atharva System and its team of Tableau experts are here to assist you in integrating Tableau with your existing data infrastructure. We use SAML (Security Assertion Markup Lanaguage) to harness the pre-existing identity provider configuration.
Do you provide custom Tableau consulting solutions that will meet your business goals?
Yes. Absolutely we do. With our Tableau expertise, we have helped hundreds of businesses understand Tableau’s potential over the years. With our custom Tableau development services, we provide you with market and data-driven decision-making capability, ensuring your business turns into a huge success.
What different types of services do Tableau Consultants offer?
The Tableau professional services provided by Atharva System are diversified and require a rigorous process. We go through a series of processes, such as planning, implementation, development, training, data management, support, governance, and advanced analytics.
What is the exact work of the Tableau Consultant?
At Atharva System, our tableau consultants work with clients and first understand data and requirements. Thereafter, we build vivid tableau solutions such as reports and data analytics models, dashboards, etc. We provide tableau consulting on the phone, ensuring you with optimization of data integration, user training, fine-tuning performance, and enabling data visualization.
What kind of skills are needed to become a Tableau Consultant?
To become a successful Tableau consultant, you should have proficient technical expertise and soft skills. The technical knowledge comprises platform expertise, data visualization practices, etc. To efficiently handle your Tableau desktop, clour, or server, you must learn how to deploy the entire solution efficiently.
Can Tableau handle vast volumes of data, ensuring business efficiency?
To become a successful Tableau consultant, you should have proficient technical expertise and soft skills. The technical knowledge comprises platform expertise, data visualization practices, etc. To efficiently handle your Tableau desktop, clour, or server, you must learn how to deploy the entire solution efficiently.
What is the additional benefit of working with a Tableau consulting firm?
When you partner with Atharva System, we deliver expertise that maximizes the value of Tableau. With this, we also provide customizing solutions that meet business needs. Our experts will help you analyze data and gain insights by performing advanced analytics.
Ready to Elevate Your
Business with Tableau?
We have transformed many businesses. We are excited to create a success story for your business.
Get in Touch
Send us your requirements. We will review and get back to you soon.
OR

Want to connect right now?
Choose any of below options to quick connect with our experts and start the conversation.


 Insurance


